Risk Dashboards
In the Risk Management app, depending on your role and permissions, you have different dashboards where you can monitor and manage risks.
Overarching risk dashboard
The Global Risk Dashboard displays all risks that have been created and may occur across the enterprise. Pie charts are used to evaluate the risks with their assessed risk classes for the respective areas in Aeneis. Using the tabs, you can view the diagrams of the areas individually. All risks are listed in a table below. In the table, you can use the drop-down menu in the table header to select which columns should be output in the table and use the filters in the columns to filter the listed risks.
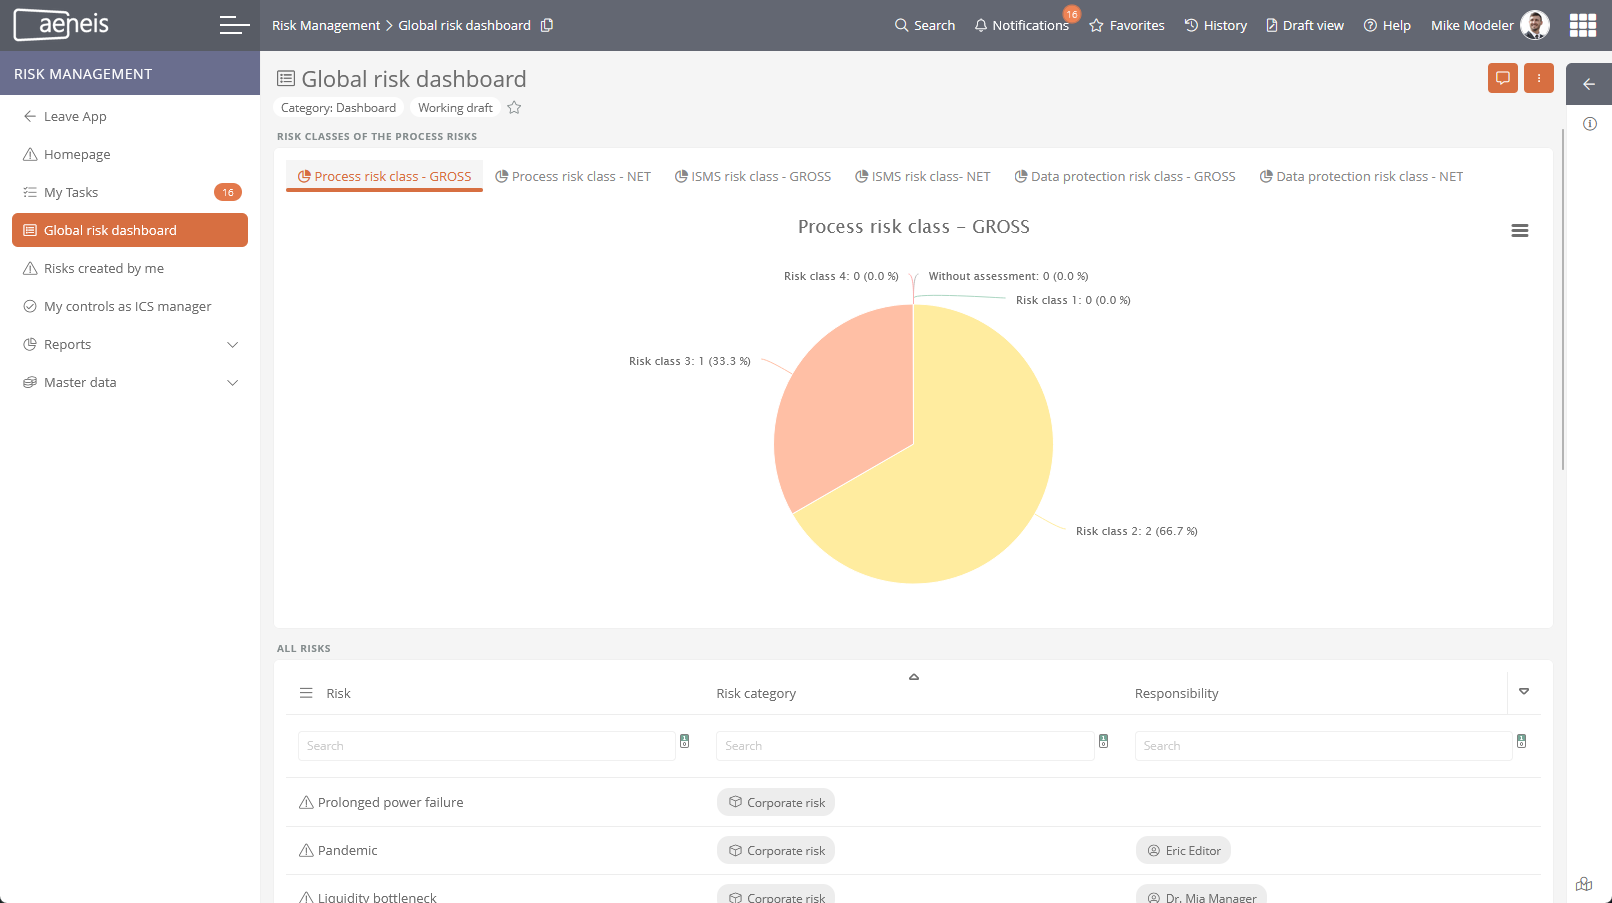
By default, this dashboard is visible to the following users:
-
App Admins
-
App key users
Risks created by me
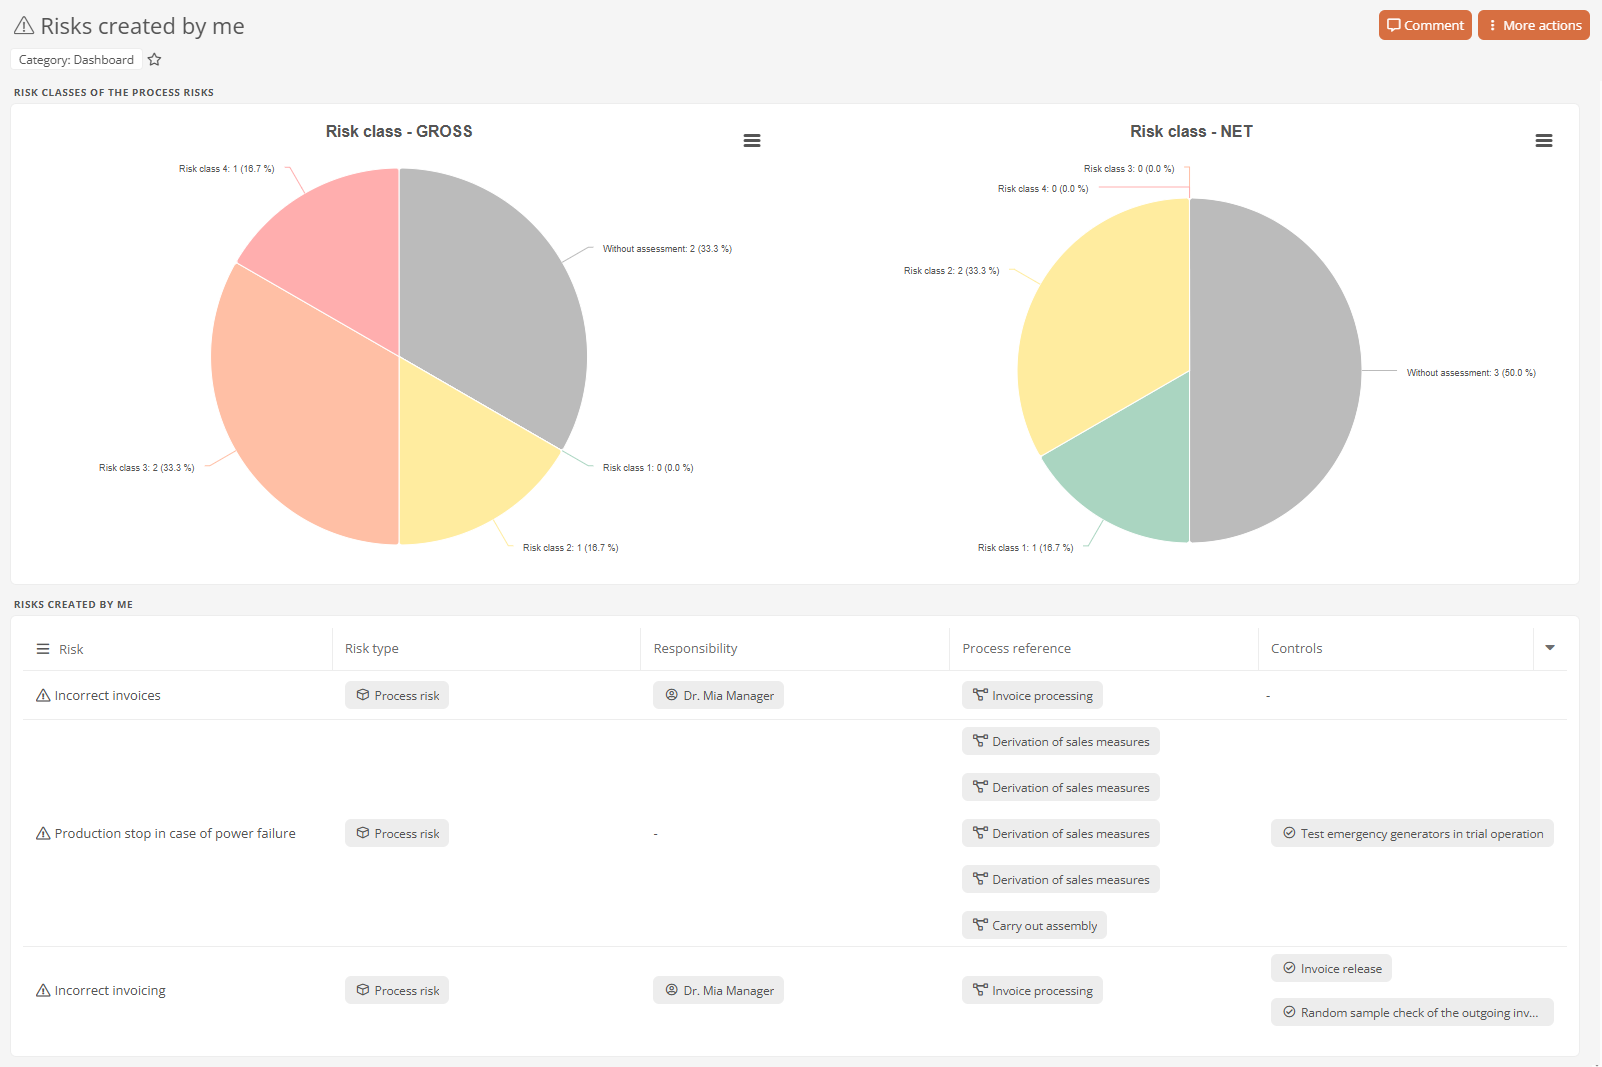
Risks created by me dashboard shows which risks you have created and how they are rated. The pie charts assess the risk classes of the risks you have created. The table below lists all the risks for which you are responsible. Using the drop-down menu in the table header, you can select which columns should be output in the table.
My controls as ICS manager
In the My controls as ICS manager dashboard for ICS managers, the controls for which you are responsible as an ICS manager are presented in tabular form.
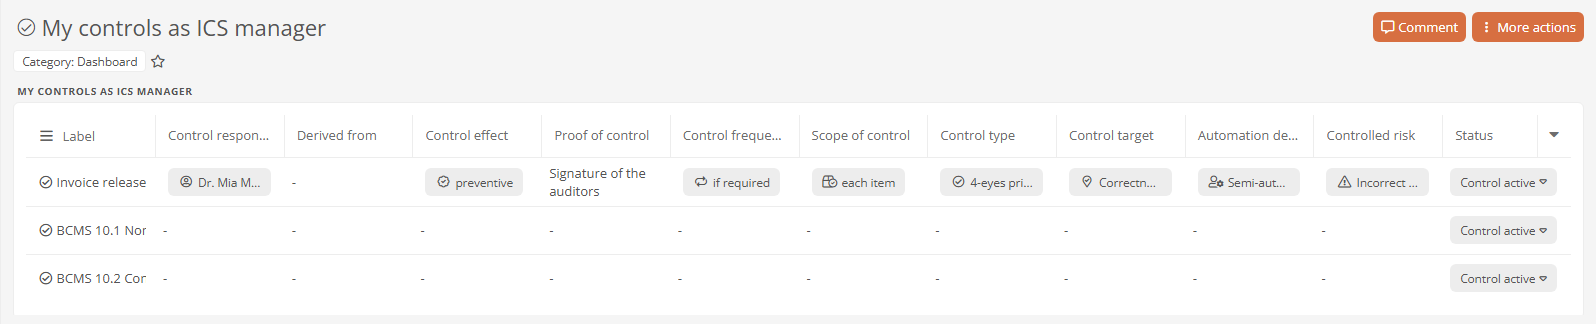
Voraussetzung: If you are assigned as ICS manager in a folder of the category Controls (Group) [GUID: 050972c9-a1dd-4c52-9802-33f8f9785961], the table will display the evaluation of the controls stored directly in that folder.