
Column charts
Column charts are representations of the subordinate structures of objects that are created and laid out automatically. The subordinate structure is displayed on a maximum of four levels.
Column charts are automatically created in the Portal for process organizations and process folders. These default column charts show which objects and variants have been created up to process level under the process organization or process folder.
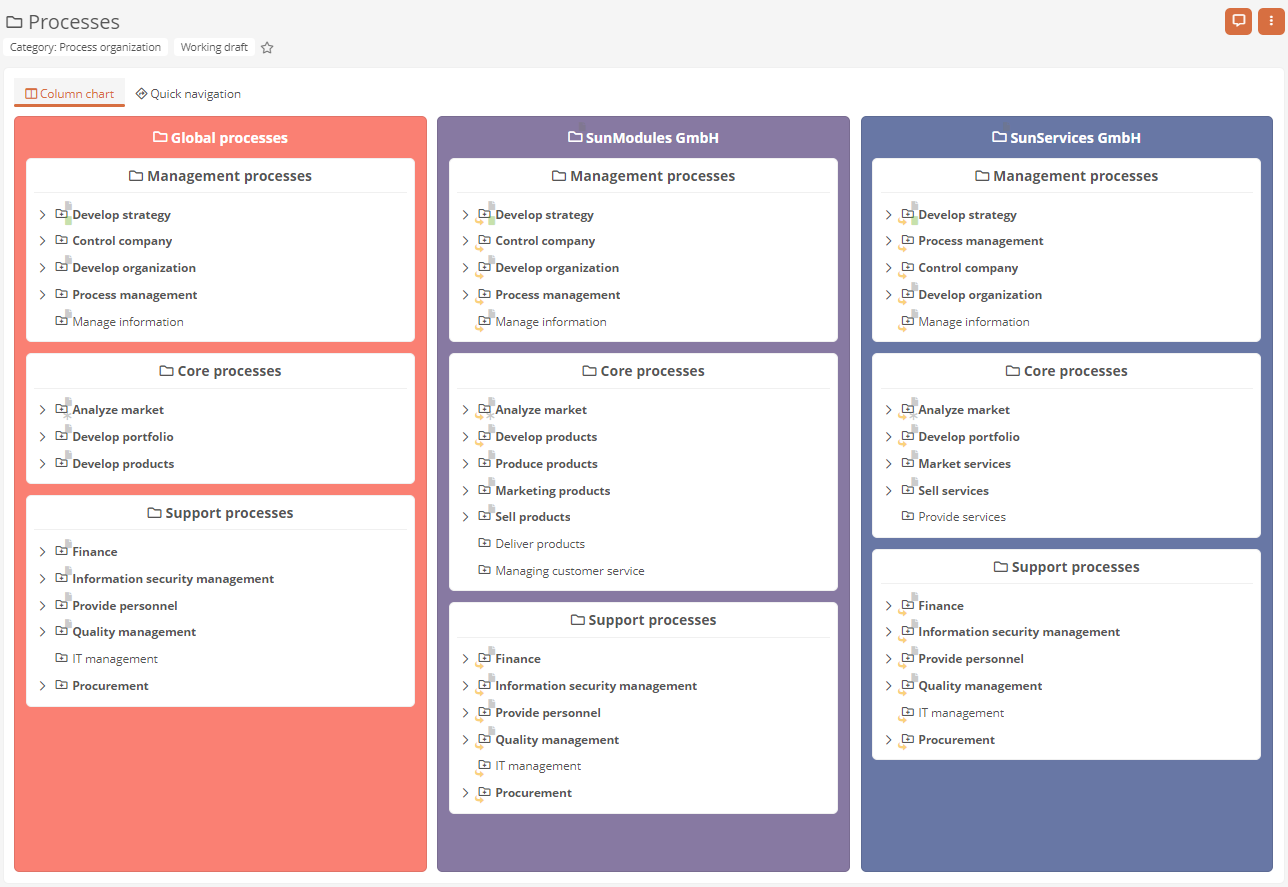
Note: Child objects such as diagrams, sub-processes, tasks, events or branches are not displayed in column charts.
See also: To find out how to configure and deactivate column charts, see Configure column charts.
Navigation concept in column charts
To navigate or select in a column chart, click as follows:
-
If you simply click on an object, the object is reported in the properties sidebar. If the object also has an arrow icon, the subordinate process structures are also displayed in the column chart.

Note: If available, variants are displayed below processes in the column chart.
-
If you double-click on an object, you navigate to the object.
 Related Topics