Process analysis view
In the Process analysis view, Aeneis analyzes key metrics related to costs, lead times, vulnerabilities, and the automation degree for the currently displayed process in various tables. The input data from the Process costs and Process analysis tables form the basis for the calculated report components in Process costing, Vulnerability assessment, and Process costing of the variants. Thanks to the SmartEdit feature in the relevant tables, you can quickly and easily enter process metrics in the Draft view.
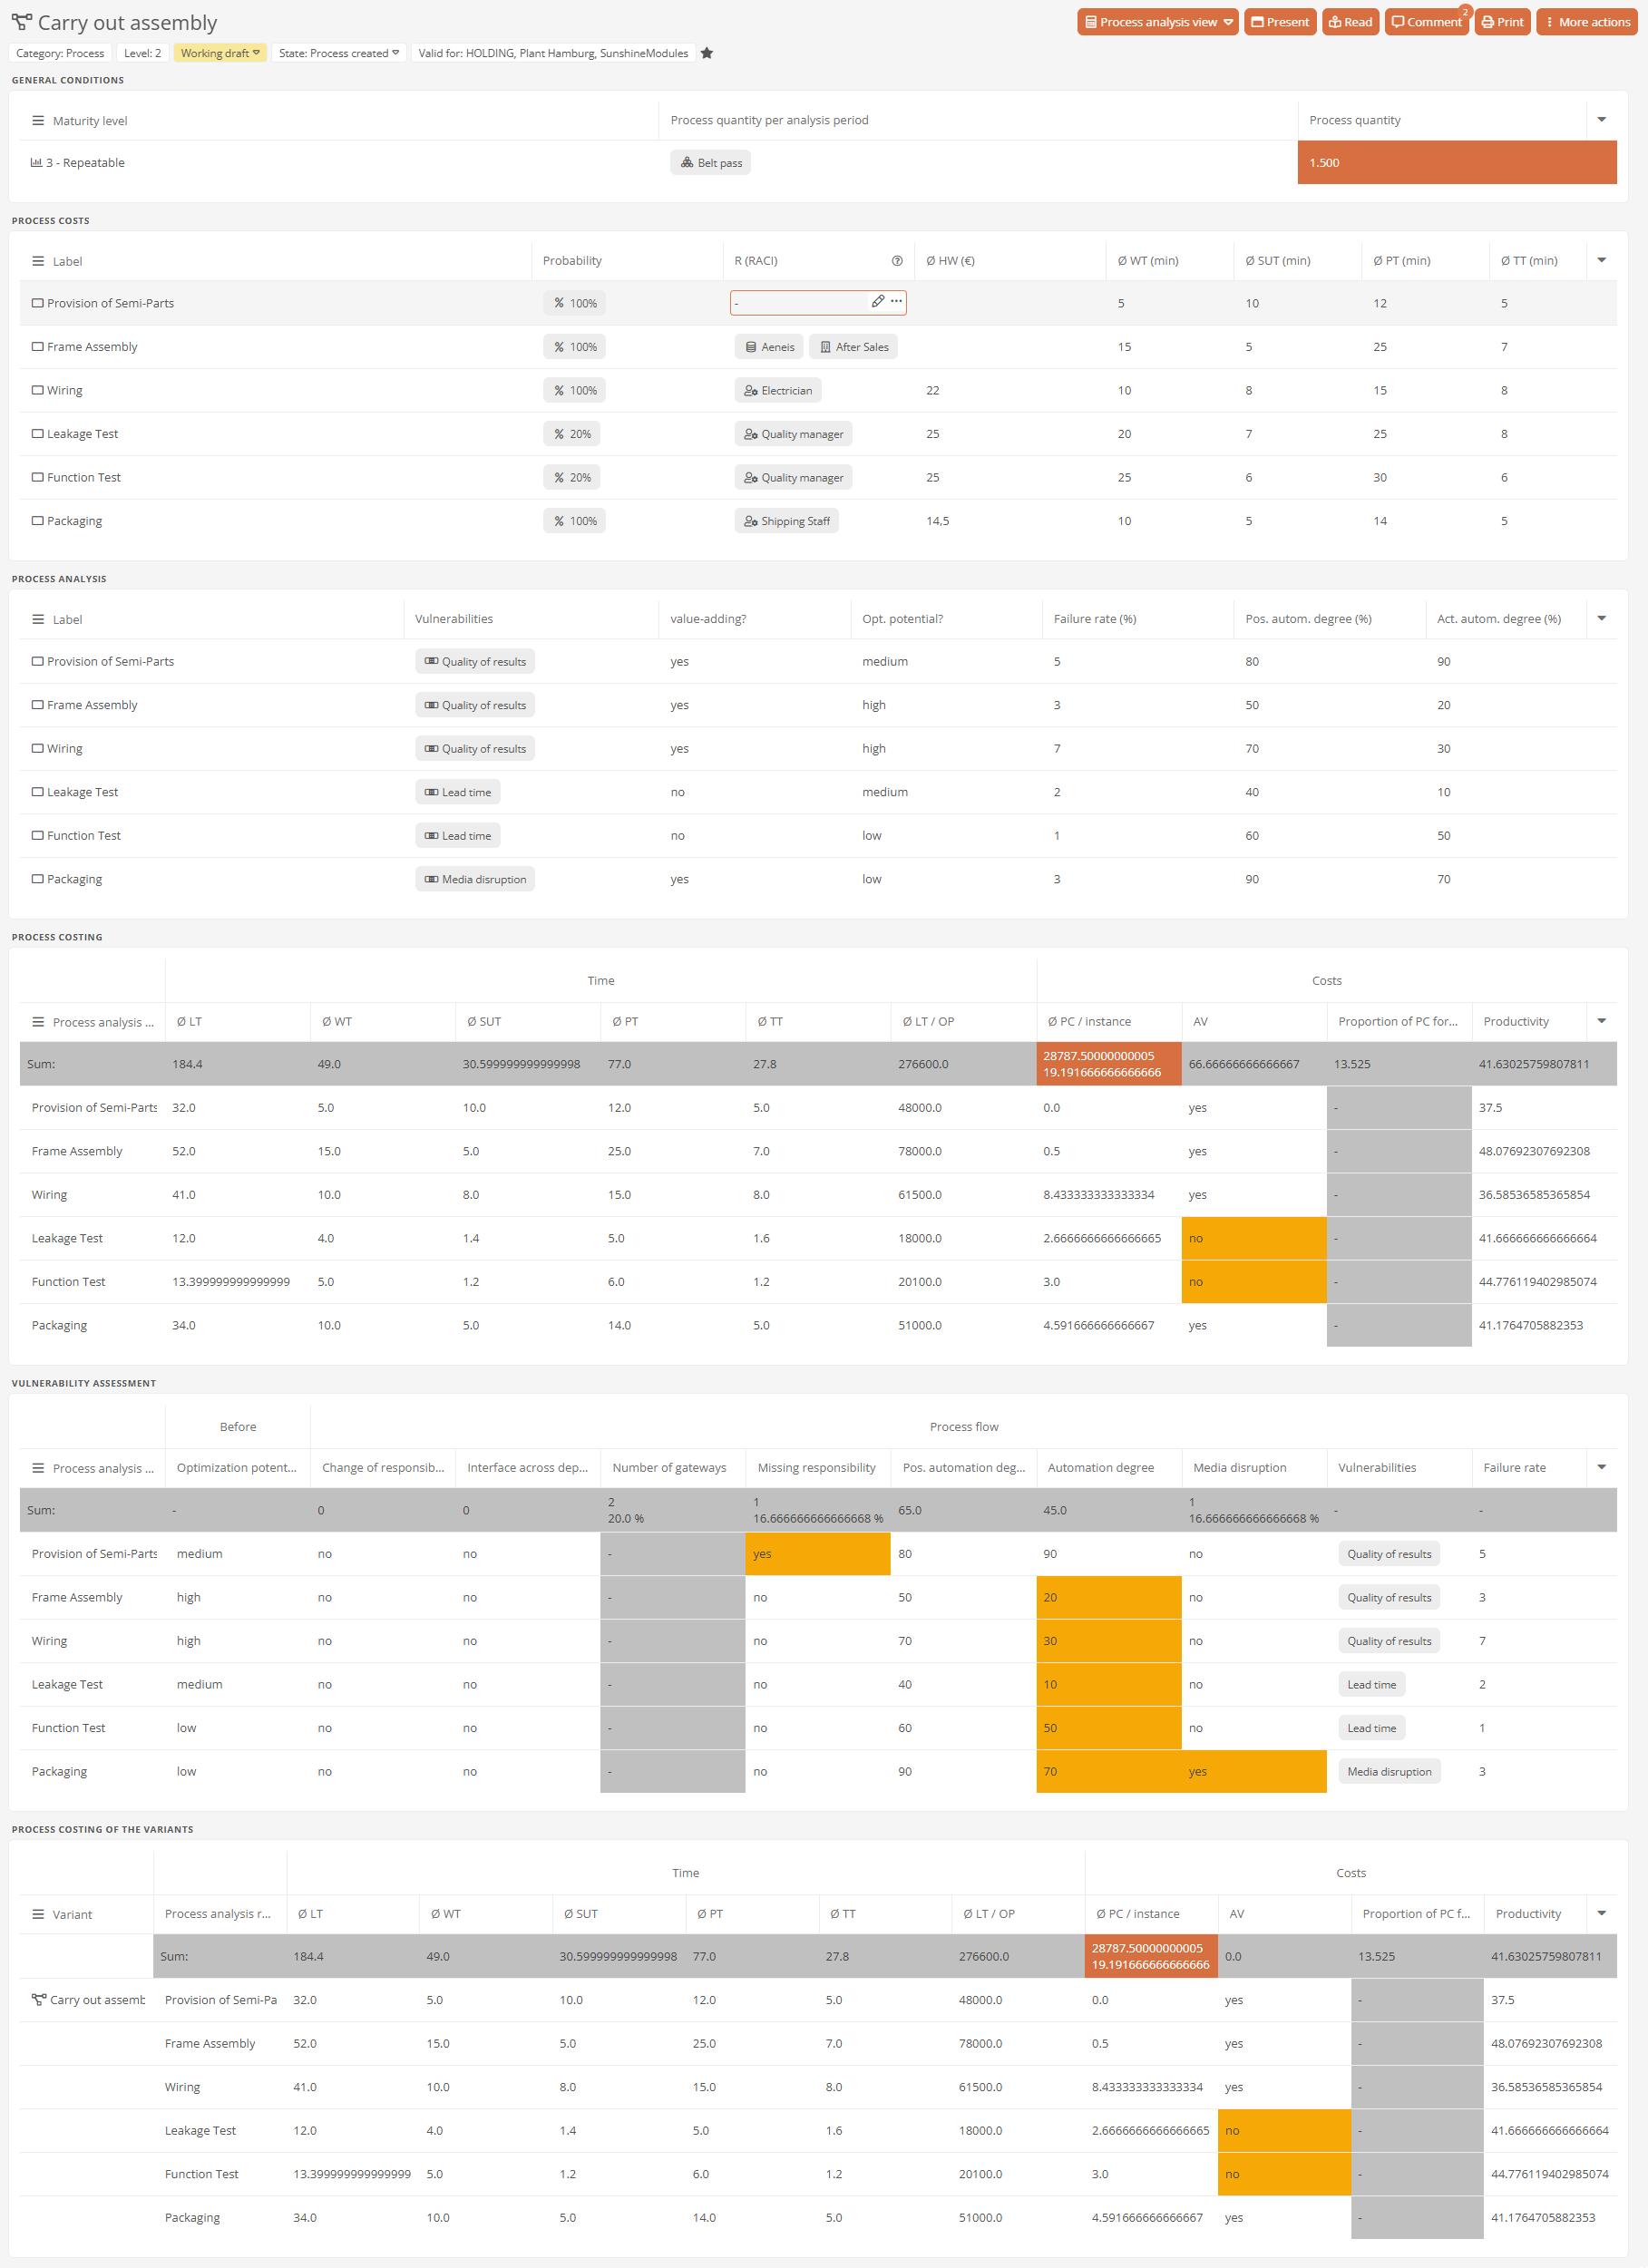
General conditions
Maturity level and process quantity are key metrics for the other report components in the process analysis. The process quantity determines the frequency to which the projections in process costing refer; the maturity level indicates how reliable the recorded values are considered to be.

|
Indicator |
Description |
|---|---|
|
Maturity level |
Displays the maturity level aggregated for the process. The following maturity levels are available:
Siehe auch: Maturity assessment |
|
Process quantity per analysis period |
Displays the time period associated with the process. |
|
Process quantity |
Displays the amount recorded during the specified time period. This metric reflects how often the process is run during the specified time period. Tipp: Set the process to the Draft view and use SmartEdit to capture the process data. Hinweis: Several key figures in Process costing, such as Ø LT / OP and Ø PC / instance in the total row, are extrapolated based on this process volume. |
Process costs
In this table, you enter the input data for process costing for each process step, such as the responsible role, their hourly wage, and waiting, setup, processing, and transport times. These figures form the basis for the calculations in Process costing.
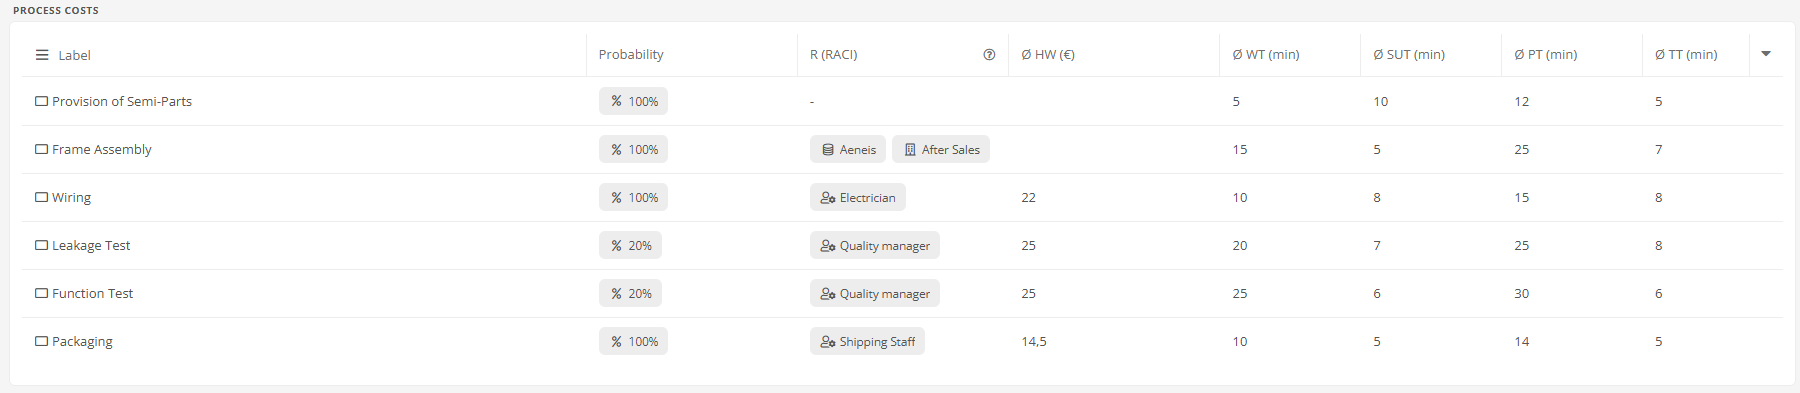
Tipp: Set the process to the Draft view and use SmartEdit to populate the table.
|
Indicator |
Description |
|---|---|
| Label | Name of the process step. |
|
Probability |
Displays the percentage probability stored in the cost driver for the process step. The cost driver indicates how frequently this process step is performed relative to the other steps. Beispiel: In a gateway, the Yes branch is taken in 90% of cases and the No branch in 10% of cases. |
|
R (RACI) |
Displays the objects assigned to the execution of the process step. |
|
Ø HW (€) |
Average hourly wage for the role assigned to performing this process step. |
|
Ø WT (min) |
Average wait time for the process step. |
|
Ø SUT (min) |
Expected average setup time for the process step. |
|
Ø PT (min) |
Average expected processing time for the process step. |
|
Ø TT (min) |
Expected average transport time for the process step. |
Process analysis
In this table, you evaluate criteria for each process step that are not directly derived from time or cost data but are assessed manually. These criteria include:
-
Vulnerabilities
-
Value creation
-
Failure rate
-
Potential and actual levels of automation
A comparison of the potential and actual levels of automation reveals which process steps can be automated but have not yet been automated.
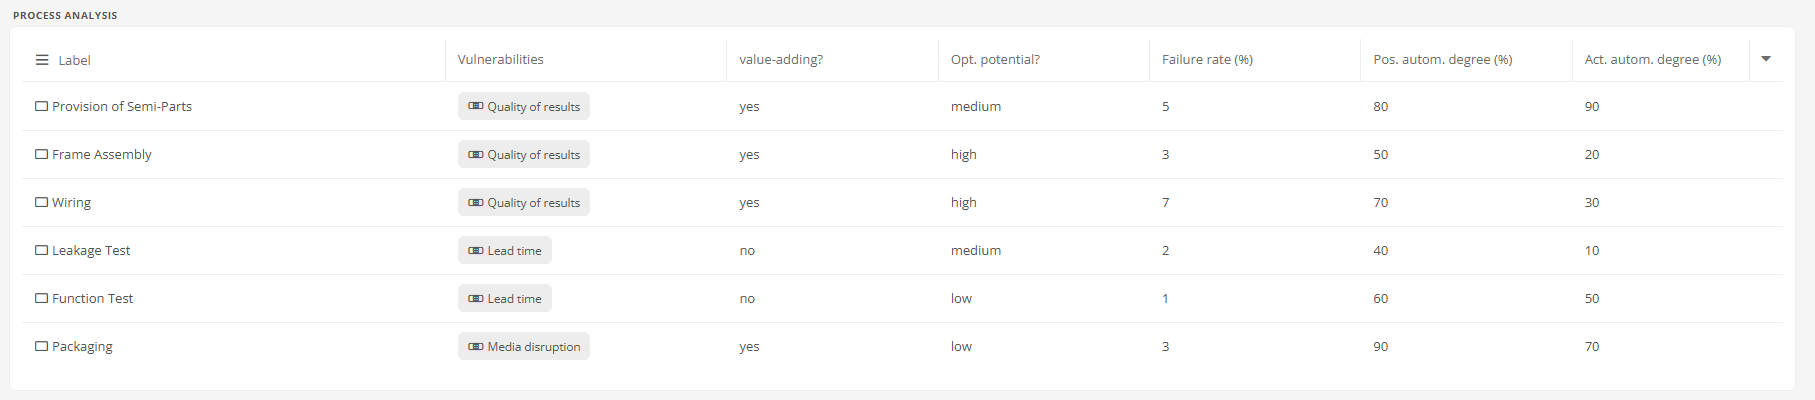
Tipp: Set the process to the Draft view and use SmartEdit to populate the table.
| Indicator | Description |
|---|---|
| Label | Name of the process step. |
| Vulnerabilities |
Displays one or more predefined vulnerabilities that have been identified for this process step. |
| Value-adding? |
Indicate with Yes or No whether the process step adds value. All value-adding process steps are included in the calculation of the AV metric. |
| Opt. potential? |
Rate the optimization potential of the process step on a multi-level scale (e.g., medium, very high). |
| Failure rate (%) |
Error rate of the process step, expressed as a percentage. |
| Pos. autom. degree (%) |
Percentage of automation possible for this process step. |
| Act. autom. degree (%) |
Actual degree of automation for the process step, expressed as a percentage. |
Process costing
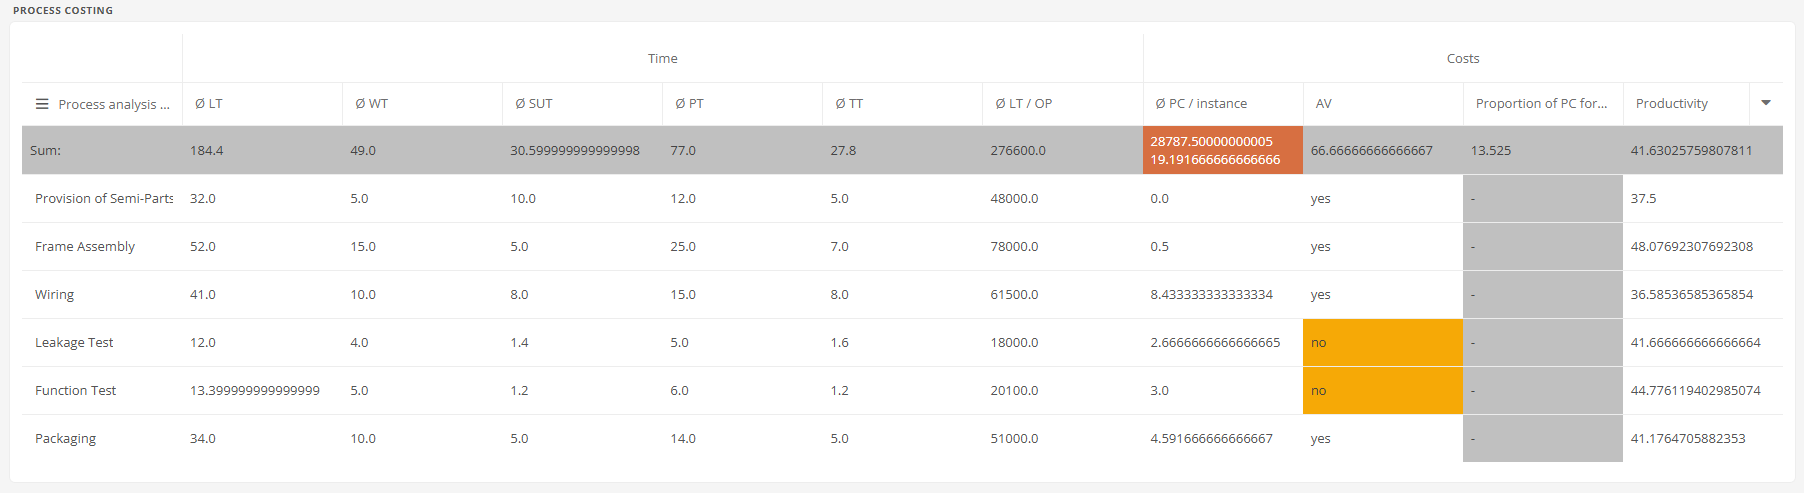
This analysis summarizes the values from the General conditions and Process costs tables to provide time and cost metrics for each process step. In the total row, the key figures are aggregated and analyzed once again.
| Indicator | Description |
|---|---|
| Process analysis report | Name of the process step to which the row refers. |
| Time | |
| Ø LT |
Average lead time of the process step (Ø WT + Ø SUT + Ø PT + Ø TT ). : Sum of the individual process steps from Ø LT. |
|
Ø WT (min) |
Average wait time for the process step. Sum: Sum of the individual process steps from Ø WT. |
|
Ø SUT (min) |
Expected average setup time for the process step. Sum: Sum of the individual process steps from Ø SUT. |
|
Ø PT (min) |
Average expected processing time for the process step. Sum: Sum of the individual process steps based on Ø PTl. |
|
Ø TT (min) |
Expected average transport time for the process step. Sum: Sum of the individual process steps from Ø TT. |
| Ø LT / OP |
Ø LT of the process step, multiplied by the process volume for the period under review. Sum: Sum of the individual process steps from Ø LT / OP. |
| Costs | |
| Ø PC / instance |
Average expected labor costs for the process step per run, calculated based on the hourly wage for the role specified in the execution, as well as processing and setup times. Sum: Sum of the individual process steps from Ø PC / instance, multiplied by the process volume. Hinweis: If no role is assigned to the execution, no value is calculated. |
| AV |
Indicate with Yes or No whether the process step is identified as value-adding. Sum: Percentage of process steps identified as value-adding. |
| Proportion of PC for AV |
Percentage of personnel costs allocated to value-adding process steps. |
| Productivity |
Productivity of the entire process or of an individual process step. Sum: Average Productivity of the individual process steps, if recorded. |
Vulnerability assessment
This analysis summarizes the key metrics from Process costing and Process analysis for each process step in a table. In the sum row, the key figures are aggregated and analyzed once again.
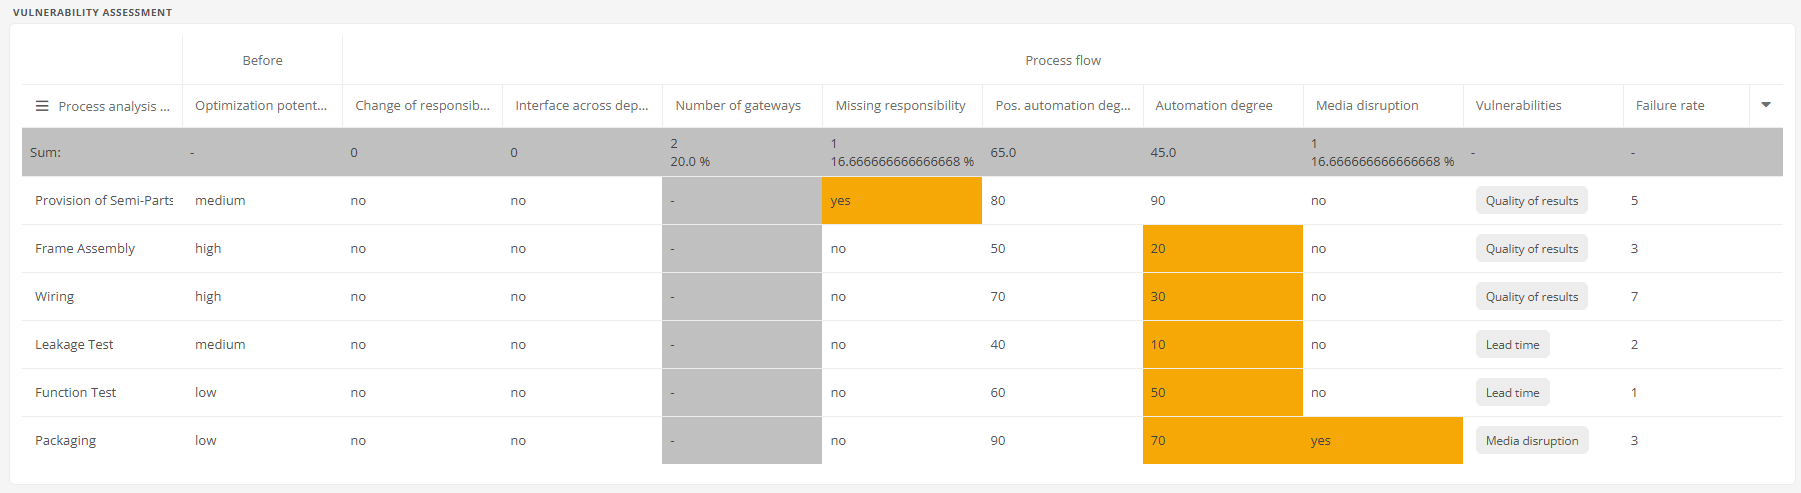
| Indicator | Description |
|---|---|
| Process analysis report | Name of the process step to which the row refers. |
| Before | |
| Optimization potential (general) |
Potential for optimizing the process step. |
| Process flow | |
| Change of responsibility |
Indicate with Yes or No whether there is a change in responsibility at this process step. The result Yes is highlighted in yellow. Sum: Number of process steps with Yes. |
| Interface across departments |
Indicate with Yes or No whether there is an interface across departmental boundaries at this process step. The Yes result is highlighted in yellow. Sum: Number of process steps with Yes. |
| Number of gateways |
Number of gateways at the process step. Sum: Number of gateways in the entire process, both in absolute terms and as a percentage of all process elements. |
| Missing responsibility |
Indicate with Yes or No whether no responsibility has been assigned to the process step. If the responsibility is missing, the corresponding cell is highlighted in yellow. Sum: Number and percentage of process steps with Yes. |
| Poss. automation degree |
Potential level of automation for the process step. Sum: Average of the individual process steps from Possible. Degree of automation, if recorded. |
| Automation degree |
Actual degree of automation of the process step. If the potential level of automation is greater than the actual level, the result is highlighted in yellow. Sum: Average of the individual process steps based on the Automation degree, if recorded. |
| Media disruption |
Indicate with Yes or No whether there are media breaks in the process step. The Yes result is highlighted in yellow. Sum: Number and percentage of process steps with a Yes response. |
| Vulnerabilities |
Vulnerabilities of the process step. |
| Failure rate |
Error rate of the process step. |
Process costing of the variants
This analysis contains the same time and cost metrics as the Process costing table, broken down by process variant. In the sum row, the key figures are aggregated and analyzed once again.
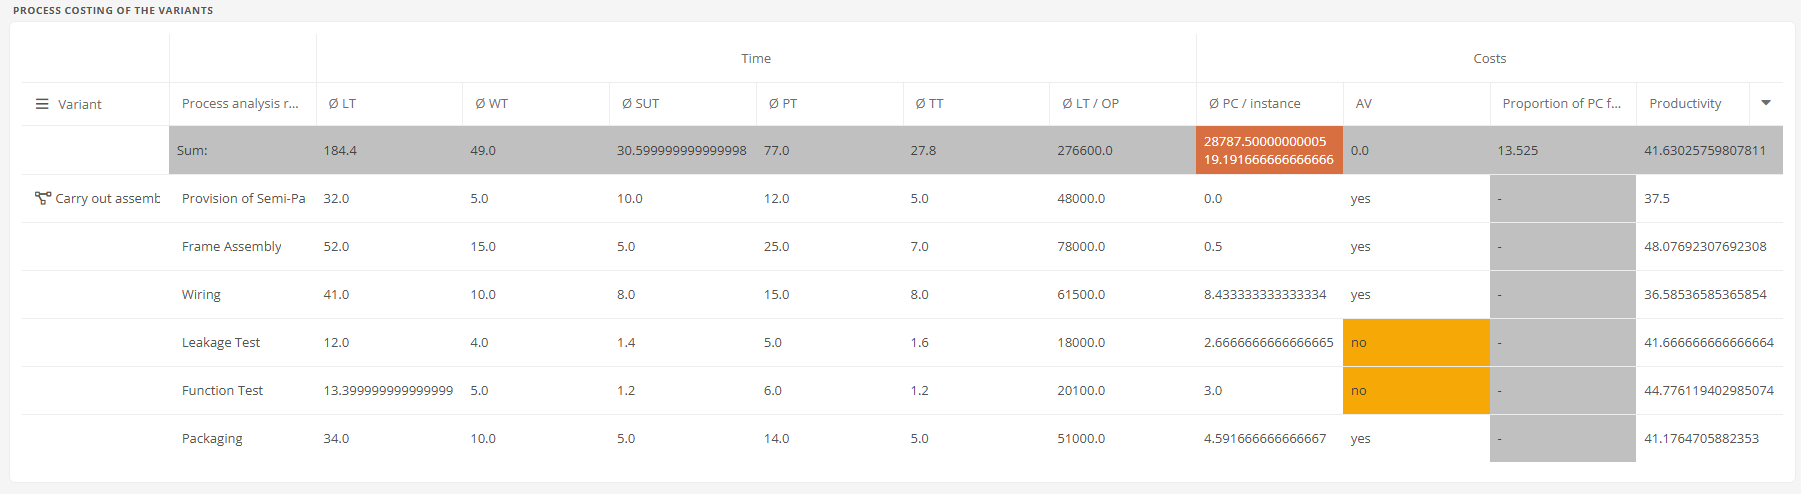
| Indicator | Description |
|---|---|
| Variant | Name of the process variant to which the embedded process costing refers. |
| Process analysis report | Name of the process step in the variant to which the row refers. |
| Time | |
| Ø LT |
Average lead time of the process step (Ø WT + Ø SUT + Ø PT + Ø TT). Sum: Sum of the individual process steps for the variant from Ø LT. |
|
Ø WT (min) |
Average wait time for the process step. Sum: Sum of the individual process steps for the variant from Ø WT. |
|
Ø SUT (min) |
Expected average setup time for the process step. Sum: Sum of the individual process steps for the variant from Ø SUT. |
|
Ø PT (min) |
Average expected processing time for this process step. Sum: Sum of the individual process steps for the variant from Ø PT. |
|
Ø TT (min) |
Expected average transport time for the process step. Sum: Sum of the individual process steps for the variant from Ø TT. |
| Ø LT / OP |
Ø LT of the process step, multiplied by the process volume for the period under review. Sum: Sum of the individual process steps for the variant from Ø LT / OP. |
| Costs | |
| Ø PC / instance |
Average expected labor costs for the process step per run, calculated based on the hourly wage for the role specified in the execution, as well as processing and setup times. Sum: Sum of the individual process steps for the variant from Ø PC / instance, multiplied by the process quantity. Hinweis: If no role is assigned to the execution, no value is calculated. |
| AV |
Indicate with Yes or No whether the process step is identified as value-adding. Sum: Percentage of the process steps in the variant that are marked as value-adding. |
| Proportion of PC for AV |
Percentage of personnel costs allocated to value-adding process steps. |
| Productivity |
Productivity of the process variant or the individual process step. Sum: Average of the individual process steps for the variant based on productivity, if recorded. |